Thursday, March 11, 2010

Activity 8 - 3D Surface Reconstruction from Structured Light

Based on stereometry, depth information can be extracted from multiple 2D views of an object. At the least, two views can be utilized in the same way as to how our two eyes work with our brain to achieve depth perception. The same effect can be done using two cameras taking the two views of an object. Matching the image coordinates of the same point on the object will provide the derivation for the depth at that point. However, this task would be very tedious when trying to reconstruct for all the points on the object. An alternative way is by replacing one of the cameras with a projector. The pixels of the projector can act as the same pixels of the camera for matching of points with the other camera. A structured pattern can represent the points on the projector as it is projected on to the object.
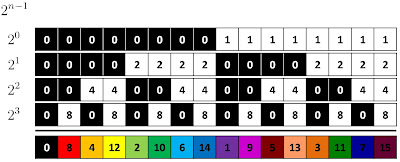
In this activity, binary codes (shown below) are used as patterns. The patterns differ by increasing the number of repetitions (cycles) of the black-white vertical strip sequence by a factor of 2. The algorithm relies on the fact that by adding these set of binary patterns multiplied by 2^(n-1), where n is the number of cycles, a unique number is obtained for each vertical strip in the added image. This is demonstrated on the diagram below, where the sum of the binary patterns (black and white strips) results into an array of unique values. This can represent the unique points on the projector that can be matched when this set of patterns is imaged by the camera.
Initially, the patterns are projected on a reference plane and then imaged to determine the points on the camera.
Image set of binary patterns projected on reference plane

Upon placing the 3D object, the vertical strips would be displaced from their initial position.
Image set of binary patterns projected on sample

The amount of shift can be determined by how many pixels that the corresponding number of that strip has been displaced from its initial position in the reference plane image. This can, then, be easily related to the depth of the object, allowing 3D reconstruction of the object:

(To be continued)

Activity 6 - Camera Calibration

Camera calibration is usually done to obtain the necessary parameters for relating the image (pixel) coordinates into the real world coordinates. This is an essential procedure in three-dimensional (3D) object reconstructions because 3D rendering requires the physical transformation values of the real world coordinates into image coordinates done by the camera.
Two techniques are presented in this activity. One is by utilizing a 3D calibration checkerboard while the other uses a flat (2D) checkerboard only. In the first method, the 3D calibration checkerboard (in the image below) would provide the real world coordinates.

The image coordinates can then be obtained from the pixel location of the points of the real world coordinates in the image of the checkerboard. Sample real world coordinates and their corresponding image coordinates are used to solve for the properties(parameters) of the camera, as shown in the equation below:
The a's constitute a matrix A that holds the camera properties.

For the second method, the Camera Calibration Toolbox in MATLAB was used. The toolbox was downloaded from http://www.vision.caltech.edu/bouguetj/calib_doc/, which also includes examples in using the toolbox. Multiple images of the flat checkerboard was imaged and loaded in the toolbox. Then, for each image, the corners of the checkerboard was pinpointed to be used by the program for obtaining the parameters of the camera. The number of boxes along the length and width of the checkerboard, and the dimension of each box was also specified. The multiple images used for the toolbox would produce a statistical measurement of the camera parameters, and essentially, a more accurate measure compared to first method. The flat checkerboard images are shown below
The results of the two methods are presented in the table below. The outputs of the two methods are comparable, with the values of the first method close to the range of values of the second method, showing the consistency of the calculation between the two. However, an anomalous value of a negative focal length along the y for the first method, is obtained. This is difficult to reconcile because it has no logical physical meaning. It may have occurred due to an error in the mathematical calculation.
Human error may have been the major factor in the errors of results and the difference between the two results. Locating the points, such as the real world coordinates in the first method and the flat checkerboard corners in the second method, is a tedious task resulting to inconsistency in the judgment of pinpointing the coordinates. Moreover, the finite resolution of the camera limits the accuracy of the calculation in terms of localizing the coordinates.

Wednesday, March 10, 2010

Activity 4 - High Dynamic Range Imaging

Cameras have a limited capability of accurately mapping the variation of light irradiances coming from a scene. Intensity values used to represent the irradiance captured by the camera are usually truncated, resulting to either the lowest or the highest value of digitization by the camera. Even if there is a difference between the light emanating from two different points on the scene, it may be mapped with the same intensity value, if the camera is saturated in this range. This is the reason why very bright and very dark parts of a scene could not be imaged with enough information to see most of its details.
High dynamic range (HDR) imaging is a technique of accurately mapping the irradiance map of a scene. The basic principle of this process is that by taking multiple images of the same scene with different exposures, a higher range of irradiances is captured. By combining the accurately mapped irradiance values (parts without saturation of intensity values) into a single image, a higher dynamic range image is formed.
Usually, HDR is applied for aesthetic and commercial purposes. A more accurate image can be constructed so that it can be appreciated even after the scene has changed. The human eyes have a larger dynamic range compared to cameras so the scene as viewed by an individual can be preserved in HDR images. HDR also have research applications. Irradiance maps are stored in HDR images. The amount of radiation emitted by a source or specimen of interest can be recovered in HDR.
In this activity, the algorithm of Debevec and Malik [1] for HDR is employed. The initial step is to find the transfer function of the camera. The transfer function describes how the camera translates the amount of irradiance it has detected to an intensity value (0-255 for an 8-bit camera channel) given an exposure time. In their paper, they provided a function for determining this. The input for the function is the log of the exposure times used to capture the scene. Intensity values are sampled from the images captured at each exposure times. By least-squares minimization, the transfer function is easily obtained using these inputs. The output is actually the log of the inverse of the transfer function of the camera.
Transfer function of red, green and blue camera channels

Once the transfer function is obtained, a simple mapping of irradiance for each pixel is performed. This process basically utilizes a backprojection procedure. Since the transfer function is known, the intensity value at an exposure time can be indexed in the transfer function to obtain the irradiance that it represents.
The whole process can be done for each channel of the camera (RGB) obtaining the transfer function for each channel. A weighting function is also introduced in the steps of least-squares minimization and backprojection. The weights provide a bias in the range where the intensity values of each image is accurately mapped, because the mapping is more accurate for intensity values far from the extremes (such as 0 and 255), or along the middle of the intensity range.
The output matrix of the algorithm should have high range of values. Most displays still have low dynamic range so there is still a limitation of viewing HDR images. Tone mapping should be applied to HDR images so that it can be displayed in low dynamic range monitors.

Set of images of a plasma taken at different exposure times

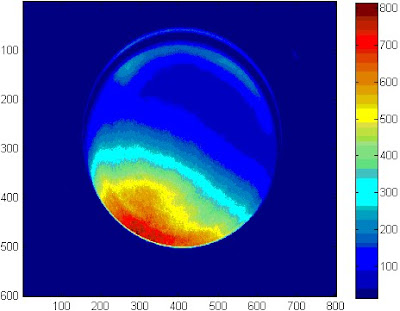
Colormap of the intensity of high dynamic range image of plasma

Histogram of high dynamic range image of plasma

From the outputs shown above, it can be seen that a high dynamic range image is obtained. The range of values now exceeds the range of pixel values of the camera (0 to 255), as seen in the colormap map and the histogram of the HDR image. Moreover, the values are no longer discrete. By inspecting the HDR image values, each pixel have decimal place values. This demonstrates the additional information contained in HDR images.
The values of the pixels are only relative values to irradiance. A calibration procedure should first be done to determine the actual irradiance of the object or scene. The calibration can be done by imaging a light source with emittance power that is already known.

(To be continued)

Reference:
[1] P. Debevec, J. Malik, "Recovering high dynamic range radiance maps from photographs," Proceedings of the 24th annual conference on Computer graphics and interactive techniques, pages 369–378, August, 1997.

Activity 3 - Silhouette Processing

Silhouette processing involves the analysis of the properties of the outlines of different types of objects. This has significant applications in feature registrations as an additional classifier. It is therefore critical to provide the necessary parameters in silhouette processing. The technique applied in this activity is the Freeman vector code. The Freeman vector code gives an alternative way of describing the relative coordinates, as shown below. A 3x3 sub-array in a binary image may look like the figure below. Whether the code is derived in clockwise or counterclockwise direction, the relative coordinate of one of the adjacent white box to the central white box ranges from 1-8, based on the numbers as shown in the diagram. If clockwise, the Freeman vector code would be 3. If counterclockwise, it would be 6. The direction in which the Freeman vector code is derived should be consistent until the code is complete, or the initial position has been reached. This is helpful in describing the outlines of an object, which is the case in silhouette processing.

Freeman vector code diagram

To perform silhouette processing, an object of interest is first chosen. The object can be imaged against a background with high contrast to easily perform edge detection of the object. Edge detection can be done using functions in Matlab or Scilab with a binary image of the object as input. It is therefore important that the object is well-distinguished from the background so that the edge is crisp, and the silhouette processing is accurate. The coordinates of the edges are converted in Freeman vector code. The difference of the codes of adjacent pixels are taken and then a running sum of three of the adjacent results are obtained. This is plotted on the image to determine the properties of the outline that the output of algorithm represents.
The sample object chosen here is the image of a letter "B." The binary image was taken and edge detection was performed. Further post-processing was implemented to obtain only the outer outline of the letter "B." This is the main focus for this activity, but it can easily be extended on the inner outlines of the letter. The extension would provide more features to characterize the shape of the letter.
Figure: (a) original sample image: letter "B", (b) binary image, (c) edge detection and (d) post-processing to obtain Freeman vector code.
After performing the algorithm, the features of the outline can be classified. The result is displayed below, with the values plotted on the location along the outline that it describes. A zoom-in on the part on the intersection curve of the two lobes of "B" shows the meaning of the resulting values. The -3 value occurs at the outline that is largely curved outward. The positive values, on the other hand, occur on inward curvatures of the outline. Zero values occur if there are no curvature. This is an effective characterization of the silhouette shape. However, there are some irregularities in the results. The kinks produce false curves. This is a result of a pixelized outline image, because the lines are not perfectly smooth. This also shows how critical the pre-processing of the image is. If the silhouette is not well-defined from the background, many irregularities may occur along its edge.

Result (click for larger view)
Result: zoomed-in view
One possible application for this technique is by analyzing handwritings. Letters can be processed, like the one used in this activity. Silhouette processing can be performed on individual letters on a signature, to determine if it is forged or not, and also to know who has written a certain handwritten document.